As the 2024/25 Fantasy Premier League (FPL) season approaches, managers face tough decisions with a wide range of premium options available.
The recent changes to FPL rules emphasise the importance of starting strong this year more than ever. Managers who avoid early squad issues will have a strategic advantage, allowing them to accumulate free transfers for critical moments later in the season.
FPL Launch Offer: Get full Premium Plus preseason access for just £1! This includes first drafts from all Elite XI: Team Reveal managers, who boast an impressive 83 top 10k finishes.
With so many options to choose from, it is prudent to look at last season’s players and cross-check underlying performance against actual points generated. In this article, we analyse the numbers to find out which players have been under-performing against the expected data, which have been over-performing, and which have been pretty much in line with expectation.
In order to analyse the underlying data, we need to use a metric to capture this. At Fantasy Football Fix, we prefer to use the compound metric Expected FPL Points (xFPL).
xFPL is calculated using Expected Goals (xG) and Expected Assists (xA), which combine as Fantasy Premier League (FPL) Involvements (xG + xA = xI). It also incorporates Expected Clean Sheets (xCS), appearance and bonus points. This metric translates these underlying statistics (i.e. shot type/location giving a probability of scoring = xG) into an overall expected FPL point score (xFPL).
We can compare this data to a player’s actual FPL points to determine whether a player should have done better than they did, given the opportunities they have had (under-performance), or when a player has done better than would be expected given the quality of the chances they have had (over-performance).
How this data is interpreted requires context and, in most cases, is a personal decision to make, with many nuances to consider.
| Player | Team | Price (£m) | xFPL Points | Actual Points | Difference |
|---|---|---|---|---|---|
| Tarkowski | EVE | 5 | 151.77 | 117 | -34.77 |
| Andersen | CRY | 4.5 | 155.29 | 121 | -34.29 |
| Robinson | FUL | 4.5 | 135.74 | 104 | -31.74 |
| Virgil | LIV | 6 | 148.33 | 117 | -31.33 |
| Luis Díaz | LIV | 7.5 | 171.81 | 142 | -29.81 |
| B.Fernandes | MUN | 8.5 | 194.46 | 166 | -28.46 |
| Romero | TOT | 5 | 134.46 | 107 | -27.46 |
| Mitchell | CRY | 5 | 146 | 119 | -27 |
| Calvert-Lewin | EVE | 6 | 126.52 | 101 | -25.52 |
| Pedro Porro | TOT | 5.5 | 160.47 | 136 | -24.47 |
Topping the table is Everton’s James Tarkowski (£5.0m) with almost 35 more xFPL points than he actually earned. An analysis of where this anomaly comes from quickly reveals that it is not from his defensive duties. In fact, Everton earned more clean sheets (13) than perhaps they deserved, given their Expected Clean Sheets (xCS) was 10.47.
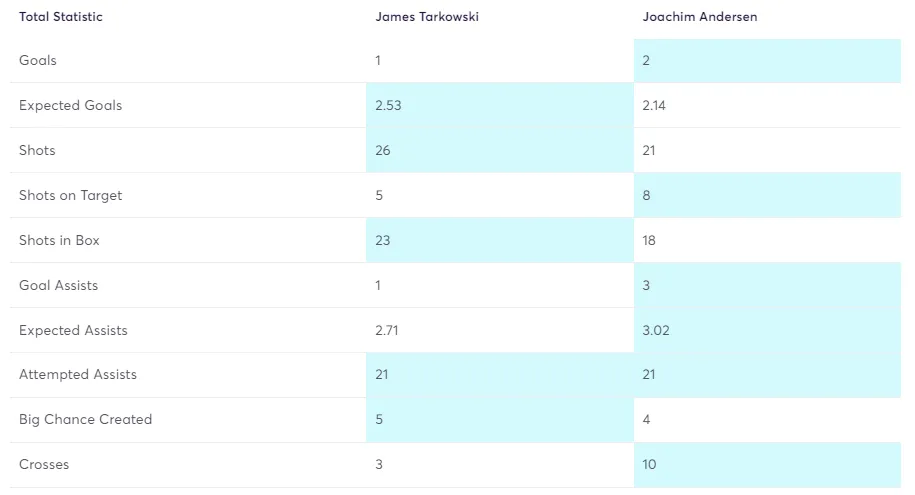
It is clear then that going forward is where Tarkowski lost out. We can see that in terms of attacking threat, the English defender managed just one goal and one assist, from an xG of 2.49 and xA of 2.71 according to the Opta Stats Sandbox. But it was how repeatedly close he came to picking up bonus points that really made the difference. Tarkowski earned 649 BPS last season but only 10 bonus points. Compare that to team mate Jordan Pickford (£5.0m) who earned around 100 BPS more (734) yet more than doubled his bonus points tally (22).
Take a look now at Joachim Andersen (£4.5m) in second place, and the underlying numbers tell the opposite story. Andersen’s expected data for attack is more or less exactly in line with reality (2 goals from 2.14 xG and 3 assists from 3.04 xA), but where Andersen has been unfortunate, is Crystal Palace conceding where perhaps they shouldn’t (58 goals conceded from an xGC of 55.64).
It is close between the two defenders, but Andersen’s price point represents slightly better value than Tarkowski at £5m.
An interesting entry in the table is Luis Díaz (£7.5m) who is ranked fifth for under-performance last season. The Liverpool winger went under the radar last season despite generating more FPL points (142) than any other Liverpool player bar Mohamed Salah (£12.5m).
The Colombian scored 8 goals from an xG of 12.40 and played more minutes (2,625) than any other Liverpool player, bar Virgil van Dijk (£6.0m). If Díaz can retain these minutes under Arne Slot’s reign, he could be a bargain at £7.5m, assuming he can bring his goal output in line with his underlying goal threat.
Top 10 FPL over-performers
| Player | Team | Price (£m) | xFPL Points | Actual Points | Difference |
|---|---|---|---|---|---|
| Foden | MCI | 9.5 | 191.53 | 230 | 38.47 |
| Watkins | AVL | 9 | 197.57 | 228 | 30.43 |
| Mateta | CRY | 7.5 | 135.39 | 165 | 29.61 |
| Diogo J. | LIV | 7.5 | 82.15 | 110 | 27.85 |
| Rice | ARS | 6.5 | 139.47 | 165 | 25.53 |
| Palmer | CHE | 10.5 | 219.32 | 244 | 24.68 |
| Rodrigo | MCI | 6.5 | 135.52 | 159 | 23.48 |
| Olise | CRY | 5.7 | 104.89 | 125 | 20.11 |
| Areola | WHU | 4.5 | 96.41 | 116 | 19.59 |
| Kudus | WHU | 6.5 | 117.47 | 137 | 19.53 |
The focus of over-performance very much falls on Phil Foden (£9.5m) who is a complicated case going into the 2024/25 season. Identified as the third best value player – in our article which identified the Top 20 best value players – Foden’s over-performance last season was monumental, with the English midfielder earning 38.47 more actual FPL points than his underlying data suggested.
While his assists were in line with expected data, his goal output was a mile off. Foden bagged 19 goals, making him Manchester City’s second top goal scorer. This was from an xG of just 10.53. When you consider that Erling Haaland (£15.0m) scored 27 from an xG of 29.44, this is a discrepancy worth noting, especially when you consider his starting price has jumped by £2m.
Conversely, if we look into the name which is second on the over-performers list, we see a similar story with Ollie Watkins (£9.0m) who is, at the time of writing, joint-first with Cole Palmer (£10.5m) for player ownership – both tied at 56.2% owned.
Let’s take a look at the top 5 most owned players in #FPL right now 👇https://t.co/d8n9wIS9wP
— Fantasy Football Fix (@FantasyFootyFix) July 22, 2024
While Watkins’ xG is pretty much in line with his goal output (18.21 and 19 respectively) we can see that his assists are off the charts. Somehow, Watkins managed to bag an insane 18 FPL assists from an xA of just 7.25. This means the low-quality chances he was providing were scored by team mates again and again throughout last season.
For both Foden and Watkins, this level of goal involvement output is likely to be unsustainable and FPL managers could well find that their price hikes don’t correlate well with next season’s numbers.
It is worthwhile having a quick look at Cole Palmer (£10.5m) whose eye-watering price rise from £5m to £10.5m makes him the second most expensive midfielder in the game. While Palmer represents amazing value, despite his price rise, there is some concern about his ability to replicate last season’s goal scoring.
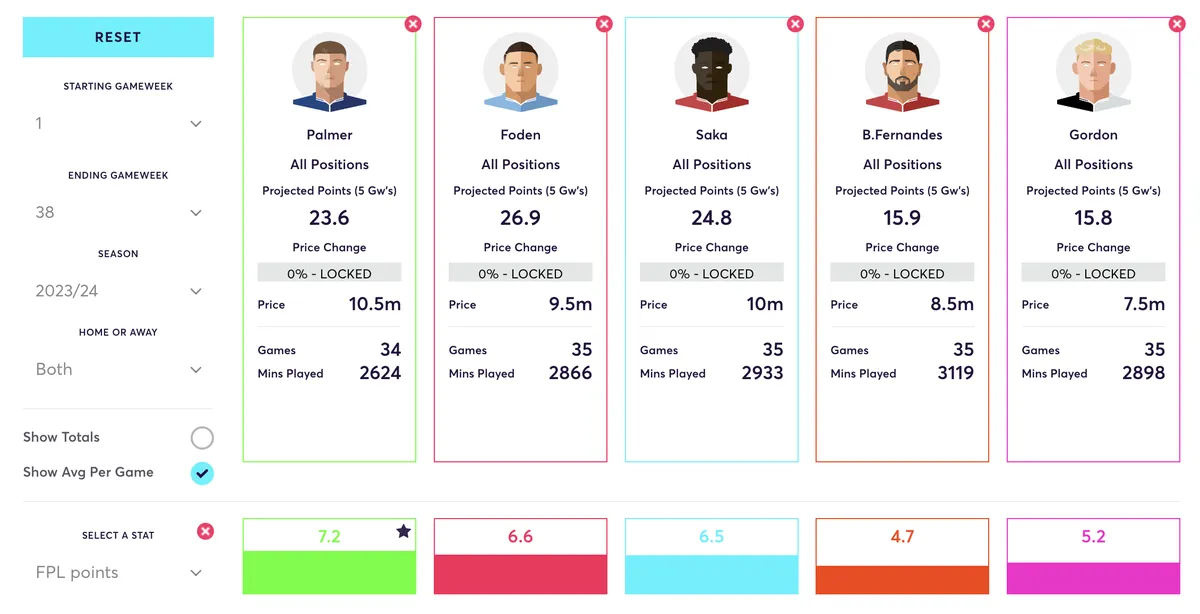
The Chelsea midfielder returned an impressive 7.2 FPL points per game in 2023/24, as shown in the Fix Comparison Matrix. However, if we take away penalties, Palmer has a non-penalty xG of 10.11 and non-penalty goals of 13. This highlights both Palmer’s reliance on penalties for goals (40% of his goals were from the spot) and also a slight over-performance in non-penalty goals.
My verdict on Palmer is that he is still a great pick, and almost a no-brainer for those going against Salah and/or Haaland, but his price this season may not justify the output, especially if Chelsea don’t get as many penalties under the new manager.
Players most in-line
| Player | Team | Price (£m) | xFPL Points | Actual Points | Difference |
|---|---|---|---|---|---|
| Gakpo | LIV | 7.5 | 103.61 | 106 | 2.39 |
| Bernardo | MCI | 6.5 | 139.07 | 141 | 1.93 |
| Semenyo | BOU | 5.5 | 105.25 | 107 | 1.75 |
| José Sá | WOL | 4.5 | 105.25 | 107 | 1.75 |
| Sterling | CHE | 7 | 121.36 | 123 | 1.64 |
| Ward-Prowse | WHU | 6.5 | 146.28 | 146 | -0.28 |
| Gallagher | CHE | 6 | 129.74 | 129 | -0.74 |
| Mac Allister | LIV | 6.5 | 110.7 | 109 | -1.7 |
| Haaland | MCI | 15 | 218.79 | 217 | -1.79 |
| Mbeumo | BRE | 7 | 129.15 | 127 | -2.15 |
Of course, FPL is not all about those players who are about to explode and/or the superb finishers for whom everything is going their way. To be successful in a campaign, we must also include those players who we can rely on to go out onto the pitch and do the job we expect.
As a result, we have included, for your reference, players who are within roughly 2 points of their expected data. Solid options who will deliver when we expect them to, and maintain consistency across the season.

FPL Launch Offer: Get full Premium Plus preseason access for just £1! This includes first drafts from all Elite XI: Team Reveal managers, who boast an impressive 83 top 10k finishes.
Join 89% of our members who won their main mini-league last season.
TRY IT NOWAlready a Premium user? Login here
© fantasyfootballfix 2024 | Terms of Use | Privacy Policy | Contact Us