With over a fifth of the FPL season already gone, we use the second international break to reflect on the campaign so far. One of the most notable aspects of this season is that it has been characterised by huge swings in variance related to underlying data, with many key FPL players either under, or over, performing.
Is this the season you’ll win all of your mini-leagues? Why not get some help by learning from the best FPL managers around. You can follow their every move in real time, just click here to unlock live team reveals.
In this article we analyse the data to find out which players have been under-performing against the expected data, which have been over-performing, and which have been pretty much in line with expectation.
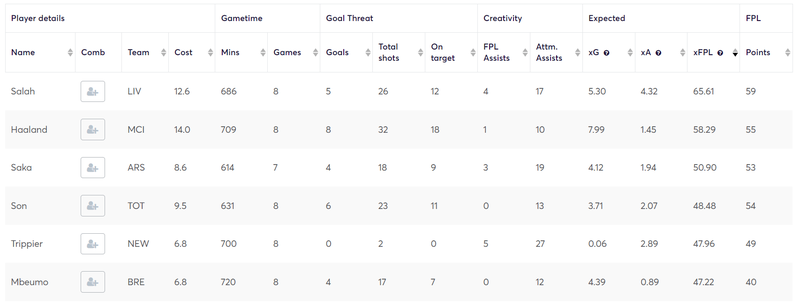
In order to analyse the underlying data, we need to use a metric to capture this. At Fantasy Football Fix, we prefer to use the compound metric Expected FPL Points (xFPL Points). But, what is it?
xFPL is calculated using Expected Goals (xG) and Expected Assists (xA), which combine as Fantasy Premier League (FPL) Involvements (xG + xA = xI). It also incorporates Expected Clean Sheets (xCS), appearance and bonus points. This metric translates these underlying statistics (i.e. shot type/location giving a probability of scoring = xG) into an overall expected FPL point score (xFPL).
We can compare this data to their actual FPL points score to determine whether a player should have done better than they did, given the opportunities they have had (under-performance), or when a player has done better than would be expected given the quality of the chances they have had (over-performance).
How this data is interpreted requires context and, in most cases, is a personal decision to make, with many nuances to consider.
| Player | Team | xFPL Points | Actual Points | Difference |
|---|---|---|---|---|
| Enzo | CHE | 34.84 | 15 | -19.84 |
| Pinnock | BRE | 36.47 | 17 | -19.47 |
| N.Jackson | CHE | 36.27 | 18 | -18.27 |
| B.Fernandes | MUN | 46.82 | 33 | -13.82 |
| Rashford | MUN | 38.99 | 28 | -10.99 |
| A.Doucoure | EVE | 44.61 | 35 | -9.61 |
| Cash | AVL | 44.71 | 36 | -8.71 |
| Eze | CRY | 33.26 | 25 | -8.26 |
| Robertson | LIV | 33.47 | 26 | -7.47 |
| Mbeumo | BRE | 47.22 | 40 | -7.22 |
Assessing under-performing players can be useful, as it can offer insight into players who are performing well, despite not earning FPL points. FPL managers who do not utilise underlying statistics can sometimes overlook – or sell – perfectly good options, just before they start converting their chances. In most cases, and given enough time, players will eventually come in line with their underlying statistics.
Of course, consistent under-performance can also mean there is a problem with that player. Perhaps his confidence is low. Maybe he is getting into all the right positions but needs to work on his finishing. Context here is important. Did the player miss because he can’t finish? Or did the opposing defender make an unbelievable goal line clearance? Did the player’s boot hit a little bump on the turf before he connected with the ball? Or was it a clean strike?
Nicolas Jackson 1 goal from 4.41 xG
— Fantasy Football Fix (@FantasyFootyFix) October 2, 2023
Armando Broja 1 goal from 0.28 xG
Using the Opta Stats Sandbox, we have put together a list of the top 10 biggest under-performers so far this season. As we can see, three of the most popular options in Gameweek 1 were Chelsea’s Nicholas Jackson (£6.9m), and the Manchester United double-up of Bruno Fernandes (£8.4m) and Marcus Rashford (£8.8m). Ownership of these three players will have defined the poor start to the season many FPL managers have endured.
An interesting, and somewhat unexpected, player at the top of the table is Enzo Fernández (£4.9m). Enzo has registered zero goals and zero FPL assists, despite accumulating 2.23 xG from 16 shots and an xA of 1.50. A penalty miss against West Ham in Gameweek 2 will have accounted for a sizeable chunk of this issue. Owned by just 3.4% of FPL managers, Enzo could be a decent budget enabler in midfield (if you can stomach Chelsea’s fixture run!).
| Player | Team | xFPL Points | Actual Points | Difference |
|---|---|---|---|---|
| Watkins | AVL | 44.74 | 59 | 14.26 |
| Jensen | BRE | 31.76 | 46 | 14.24 |
| J.Alvarez | MCI | 37.72 | 48 | 10.28 |
| Andersen | CRY | 42.8 | 51 | 8.2 |
| Johnstone | CRY | 31.16 | 38 | 6.84 |
| Neto | WOL | 36.66 | 43 | 6.34 |
| Son | TOT | 48.48 | 54 | 5.52 |
| Gordon | NEW | 31.58 | 37 | 5.42 |
| Leno | FUL | 32.8 | 38 | 5.2 |
| Sterling | CHE | 40.05 | 45 | 4.95 |
It is equally important to assess when players are over-performing. As with under-performers, those who are scoring from low-quality opportunities will eventually find that their output comes back in line with what is expected. Of course, we may see a player who just has a gift for scoring long-range screamers, but this is the exception rather than the rule. Generally, over-performance is not sustainable over a season.
This data can be utilised to warn managers of ‘points which may already have been missed’ and to identify players who perhaps haven’t been playing brilliantly but have managed to rack up points through either good fortune or good finishing. Such players may need to be avoided – or even sold – despite their high-scoring history.
Top of the list is Ollie Watkins (£8.1m) who has scored an amazing 14.26 points more than his expected data would suggest. This is an interesting one; the vast majority of this over-performance (12.63) comes from Gameweek 7, when Watkins racked up a crazy 3 goals and 2 assists from just 1.13 xG and 0.29 xA. Other than this, Watkins has been more or less in line with his underlying data.
What does this suggest? Watkins is still a good pick (the Fixture Planner has Aston Villa ranked 2nd over the next four Gameweeks) and he will continue to return, but the 23-point haul against Burnley was an outlier which will probably not be repeated.
Which of the top 5 most highly owned players will come out on top in Gameweek 8? pic.twitter.com/M1pUeTtATh
— Fantasy Football Fix (@FantasyFootyFix) October 8, 2023
Julián Álvarez (£7.0m) is also a significant FPL asset who makes the over-performers list (ranked third). Unlike Watkins, his over-performance is far more spread out across the Gameweeks. It is also more focused on his assists than his goals. Álvarez has scored 3 goals from an xG of 2.8 – which feels just about right. Assists, however, are a different story; the Argentine forward has 5 FPL assists from an xA of 1.2.
Again, whether this is sustainable in the long-term is a personal judgement. FPL managers will be right to be wary of a potential drop in assist output based on these figures, but it must also be factored in that Manchester City are something of an anomaly when it comes to precision and their ability to finish chances. In any other team, a regression to the mean may be on the cards, but when you are passing the ball to the likes of Erling Haaland (£14.0m) and Phil Foden (£7.6m), who knows.
| Player | Team | xFPL Points | Actual Points | Difference |
|---|---|---|---|---|
| Van de Ven | TOT | 32.22 | 34 | 1.78 |
| Ward-Prowse | WHU | 35.77 | 37 | 1.23 |
| Morris | LUT | 35.92 | 37 | 1.08 |
| Trippier | NEW | 47.96 | 49 | 1.04 |
| Solanke | BOU | 31.25 | 32 | 0.75 |
| Pau | AVL | 31.21 | 31 | -0.21 |
| Douglas Luiz | AVL | 35.35 | 34 | -1.35 |
| Disasi | CHE | 35.69 | 34 | -1.69 |
Of course, FPL is not all about those players who are about to explode and/or the superb finishers for whom everything is going their way. To be successful in a campaign, we must also include those players who we can rely on to go out onto the pitch and do the job we expect.
As a result, we have included, for your reference, all players who are within 2 points of their expected data. Solid options who will deliver when we expect them to, and maintain consistency across the season.

You can check out the Elite XI: Team Reveal tool by clicking HERE.
Join 89% of our members who won their main mini-league last season.
TRY IT NOWAlready a Premium user? Login here
© fantasyfootballfix 2024 | Terms of Use | Privacy Policy | Contact Us