This blog has been taken from the Preseason Pack section of the website which you can access HERE. It takes a look into how the most successful teams distributed their budget with a view to arriving at the optimal spending in each position last season.
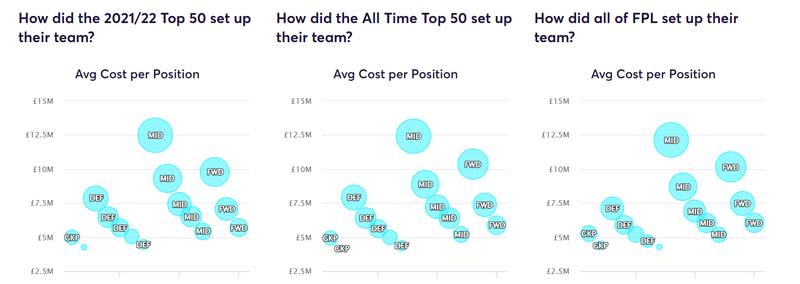
This chart shows the average cost for each of the 15 players in the Top 50's teams. Note that the cost of each player through the season is taken as their gameweek cost, rather than their original cost at the start of the season.
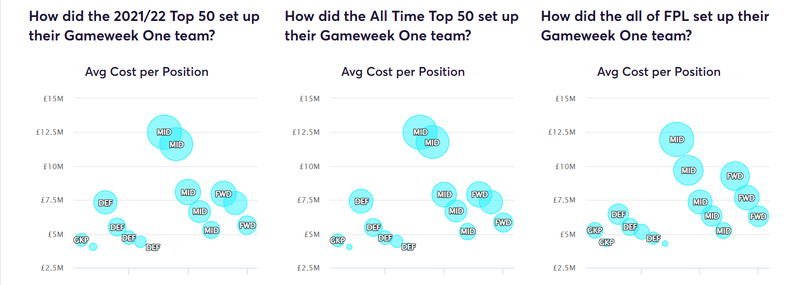
This chart shows the average cost for each of the 15 players in the Top 50's teams for Gameweek One.
The ‘2021/22 Top 50’ and the ‘All Time Top 50’ user groups both opted for a similar goalkeeper setup at the start of the season with a budget 4.5 starting goalkeeper and a 4.0 “bench fodder” option. The ‘All FPL’ user group spent significantly more on Goalkeepers with an average spend of 5.3 for the starting keeper and 4.4 for the bench option. This would indicate that this group opted for the premium goalkeepers such as Alisson, De Gea, Lloris, Mendy etc. while they also opted for a playing 4.5 option as a backup.
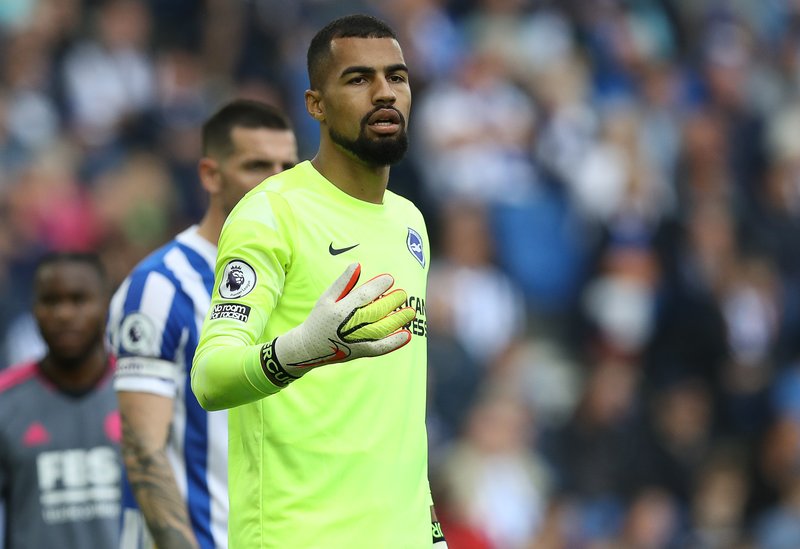
Robert Sanchez, a £4.5m goalkeeper, was a popular choice with the Top 50 managers at the beginning of the season.
The 4.0 backup keeper strategy adopted by the ‘All Time Top 50’ and ‘2021/22 Top 50’ is especially viable when a team’s backup goalkeeper is available for 4.0, which was the case with the Sanchez/Steele combo or Bachmann/Foster. In the event of the main goalkeeper getting injured/suspended, the backup Goalkeeper from the same side would step in which would ensure a starting goalkeeper every week for an outlay of just 8.5. A small percentage of the overall budget.
As was the trend last season, the ‘All FPL’ user group spent an average of 4.4 for their backup goalkeeper which indicates that they opted for a starting budget goalkeeper as backup, rather than “bench fodder”. Overall, the ‘All FPL’ user group had an average spend of 9.7 on goalkeepers compared to just 8.5 for the other two groups.
COVID absences, fixtures being postponed and players missing out randomly took its toll in 2021/22. The evidence for this can be seen in both the ‘2021/22 Top 50’ and the ‘All Time Top 50’ user groups, since they adapted their style and spent more on their backup Goalkeeper, taking the spend up to 4.3 by the end of the season. Watford backup goalkeeper Foster had become the first choice at a price of just 4.1 which enabled this strategy further. The ‘All FPL’ group’s spending on the backup Goalkeeper stayed consistent at a 4.4 average, even come the end of the season.
At the start of the season both the ‘2021/22 Top 50’ and the ‘All Time Top 50’ user groups opted for a higher average spend of 7.4 on their first defender compared to just 6.5 for the ‘All FPL’ user group. The first two groups likely went for Liverpool’s Alexander-Arnold while the ‘All FPL’ group likely went for cheaper premium defensive options from the likes of Chelsea and Manchester City (Azpilicueta and Dias etc.). As the season wore on, it is interesting to see the spending increase on the first defender spot to 7.1 for the ‘All FPL’ group which indicates they adapted and saw value in the premium defenders.
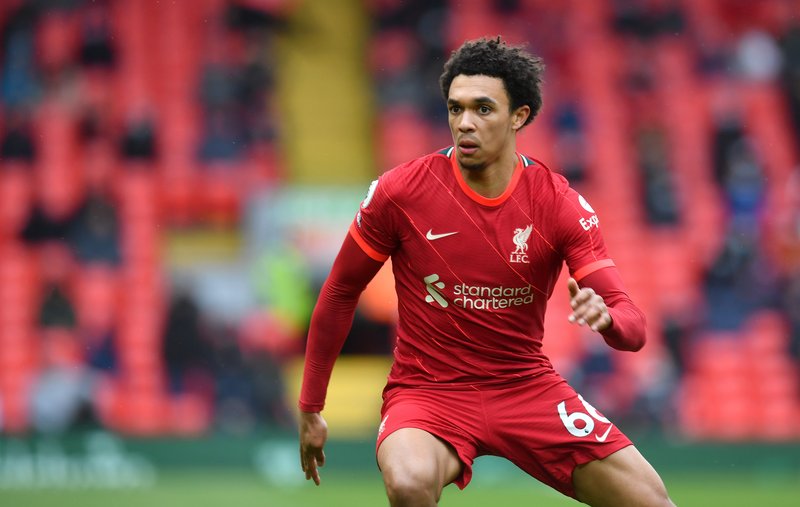
Alexander-Arnold, a highly owned premium defender with top managers.
The ‘2021/22 Top 50’ and the ‘All Time Top 50’ user groups started with a spend of 5.5 on the second defender but that spend went up to 6.5 by the end of the season which is a significant increase. Their spending on the third defender also went up to 5.7 from 4.7 and spending on the fourth defender went up as well from 4.4 to 5.1. There is clearly a trend here, where all user groups shifted more money to defence. With several defensive options such as Cancelo, R. James, Alonso, Dias, Robertson etc. offering explosive potential at a budget price, many of them likely also changed formations to accommodate these players.
A shift with the ’All FPL’ user group also occurred, but it was not as noticeable as the more successful user groups. Spend on the second defender went up to 5.9 from 5.5, and the spending on the third and fourth defensive position stayed consistent at 5.2 and 4.7 respectively.
The increased spending in defence is a trend likely to continue into the 2022/23 season. The role of the modern full-back is no longer just to defend but also to provide attacking impetus at the other end of the pitch with goals and assists. The bonus point system naturally favours them with all their actions, and a goal or assist can lead to them racking up a huge score. Several of them are also the creative go-to for their sides such as Alexander-Arnold and R. James.
It is also interesting to note that the spend on the fifth defender stayed consistent throughout the season at about 4.5. The most successful managers clearly saw this as a spot where they could save money and often opted for a budget option that was guaranteed minutes.
The ‘2021/22 Top 50’ and ‘All Time Top 50’ user groups spent a significant portion of their budget on first two midfield positions, averaging a total spend of 24.0. This was likely spent on Salah and B. Fernandes who had stellar campaigns in 2020/21 and had kind fixtures to start off with in 2021/22. They were both reliable captain options who had consistently delivered in the past so starting with these two premium assets made sense.
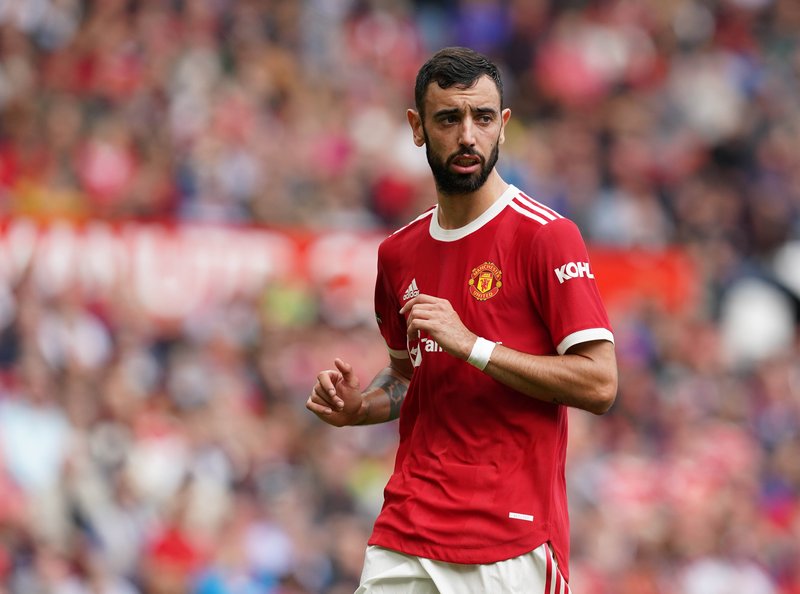
B. Fernandes was a popular choice due to his successful 2020/21 season.
However, it is interesting to note that as the season progressed, spending on the first midfielder remained consistent at 12.5 but the spending on the second midfielder dropped significantly to an average of 9.1 amongst the most successful managers. This is likely due to the inconsistency shown by B. Fernandes after a stellar start to the campaign, and the availability of great mid-priced midfielders such as Bowen, Maddison etc. who delivered huge returns at a cut-down price. Salah also, once again, emerged as a ‘permacap’ (permanent captain) option which reduced the need for a second premium midfielder.
As has been the case in recent seasons, the top scorers such as Salah and Son fall under the midfield category, and with these midfielders playing more as forwards they are simply too good to pass up on, with multiple routes to points. They are also the most reliable captaincy options and investing in two premium midfielders looks like a good strategy to take into this season coming.
The third midfielder spot also saw a difference in spending between the most successful managers (average 8.0) and the ‘All FPL’ user group (average 7.4) at the start of the season. It is interesting to note that spending on this position dropped by 0.6 over the course of the season, across all three groups. This is again likely due to the availability of great options in the 6.5-7.5 price range and very few options in the 8.0-9.0 bracket.
The spending pattern for the fourth midfield slot was similar across all groups (6.3-6.7) and a similar trend was seen with the fifth midfield slot as well (5.2-5.3). The spend on the fourth slot dropped by about 0.4 across all groups over the season but the spend on the fifth midfielder remained consistent at 5.3. It is likely that the funds were sacrificed in midfield to spend more on premium defenders.
Premium forward options were extremely limited at the start of the season, Kane missed the start of the campaign, Man. City and Liverpool were playing without a recognised striker and Lukaku had not yet signed for Chelsea. This left very few options for investment which saw an average spend of just 8.0 on the first striker spot by the most successful managers. This shot up to 10.1 by the end of the campaign as Kane, Ronaldo and Vardy all became viable options.
In contrast, the ‘All FPL’ user group started with a much higher spend of 9.3 on their first striker and this average went up to 10.2 by the end of the season, a figure close to the more successful managers.
The spend on the second striker spot was similar across the user groups (7.3-7.7) and this number stayed consistent throughout the campaign with a variety of forwards such as Antonio, Watkins, Richarlison etc. offering great value.
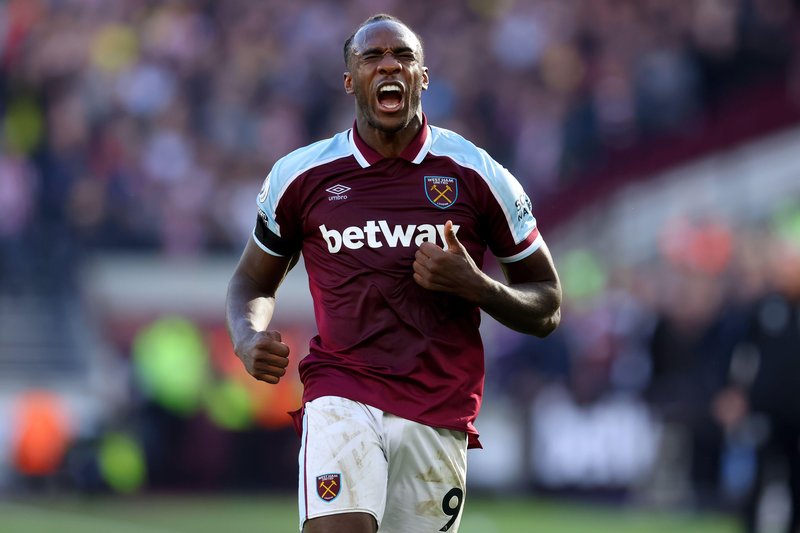
Antonio was seen as great value due to his returns at the beginning of the season.
The outlay on the third striker spot was higher in the ‘All FPL’ user group (6.4) compared to an average of 5.7 for the other two. The number stayed consistent over the campaign for the more successful managers whereas the ‘All FPL’ group dropped their spending in this position by 0.2.
Due to the many COVID absences and postponements, it was generally observed that the most successful managers distributed their funds across their squads more in the 2021/22 campaign. Previous campaigns often saw one or two non-playing bench fodder options but factoring in the disruption COVID brought was wide and deep squads were required.
With a return to normality in the 2022/23 season, the most successful managers are more likely to revert to the pattern of spending more in their first 11 positions but with rotation, an increasing factor in the top sides, particularly now that five substitutions will be allowed, the strategy of spreading the funds on bench options could be here to stay.
You can access more anaylsis on the top 50 managers, as well as unlock tools to prepare you for next season, in the Preseason Pack by clicking HERE.
Join 89% of our members who won their main mini-league last season.
GET PREMIUM FOR £1Already a Premium user? Login here
© fantasyfootballfix 2024 | Terms of Use | Privacy Policy | Contact Us